Add and Explore a Dataset – Machine Learning Fundamental Concepts
Add and Explore a Dataset
- Next to the pipeline name on the left, select the arrows icon to expand the panel if it is not already expanded. The panel should open by default to the Asset library pane, indicated by the book’s icon at the top of the panel. There is a search bar to locate assets on the pane and two buttons, Data and Component.
- Click Component. Search for and place the Automobile price data (Raw) dataset onto the canvas as shown in Figure 3-14.
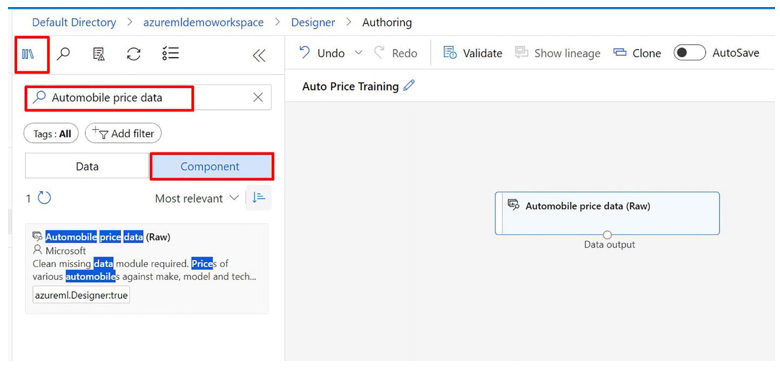
Figure 3-14Adding a dataset
3. Right-click (Ctrl+click on a Mac) the Automobile price data (Raw) dataset on the canvas as shown in Figure 3-15 and click “Preview data.”
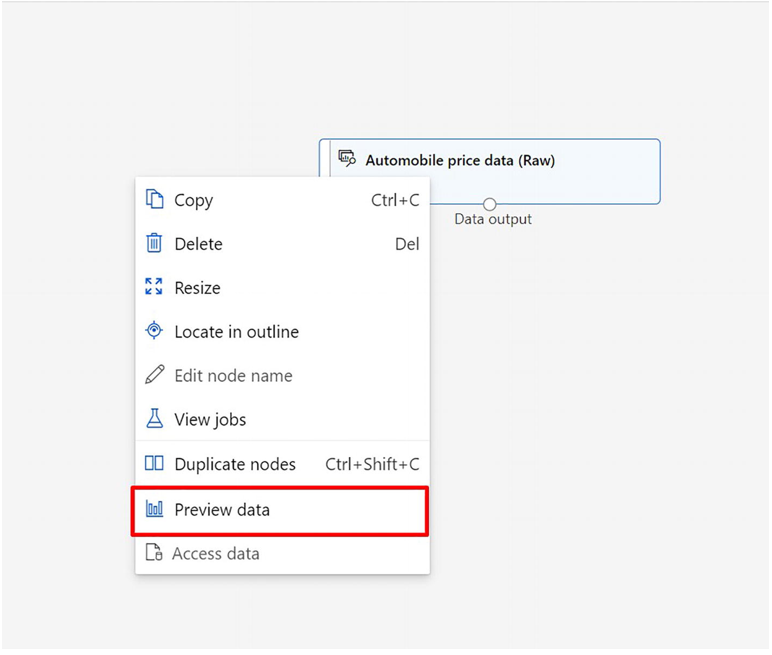
Figure 3-15Preview data
- Look at the data’s output schema, noting that you can use histograms to see how the different columns are spread out.
- Scroll right to see the Price column, which your model predicts.
- Scroll back to the left and select the “normalized losses column” header as shown in Figure 3-16. Then review the statistics for this column. Note that there are quite a few missing values in this column. If the column has missing values, it can’t be used to predict the price label as well, so you might want to leave it out of the training.
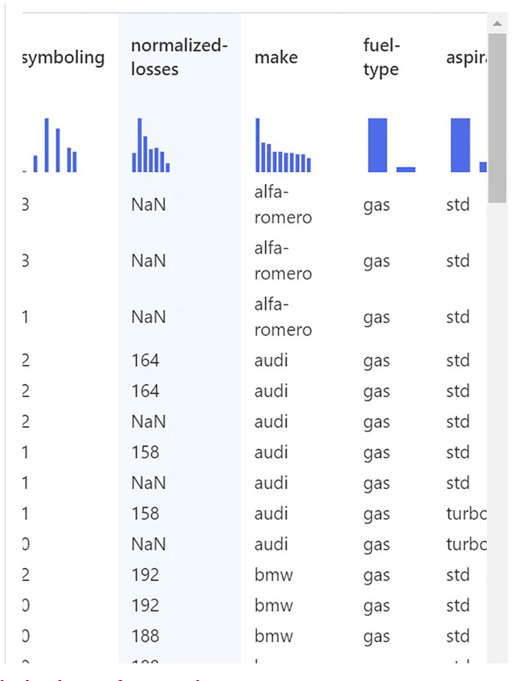
Figure 3-16Observing the distribution of various columns
Close the Automobile price data (Raw) result visualization window so that you can see the dataset on the canvas as shown in Figure 3-17.
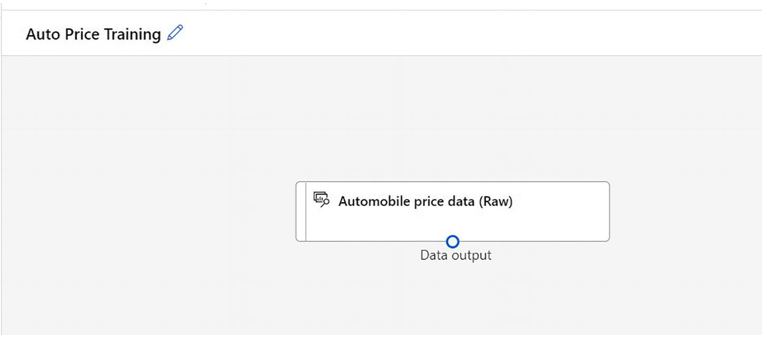
Figure 3-17Dataset on the canvas
Add Data Transformations
- In the Asset library pane on the left, click Component, which contains a wide range of modules you can use for data transformation and model training. You can also use the search bar to quickly locate modules.
- Place a Select Columns in Dataset module below Automobile price data (Raw). Connect the Automobile price data (Raw) module’s output to the Select Columns in Dataset module’s input, as shown in Figure 3-18.
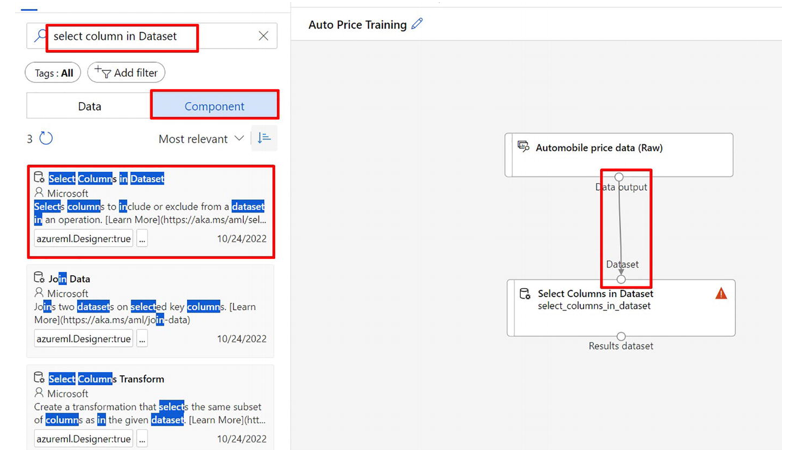
Figure 3-18Carrying out data transformation
3. Double-click the Select Columns in Dataset module to access a settings pane on the right. Select the Edit column. Then in the Select columns window, include All Columns and Add all to add all the columns. Then remove normalized-losses, so your final column selection looks like Figure 3-19.
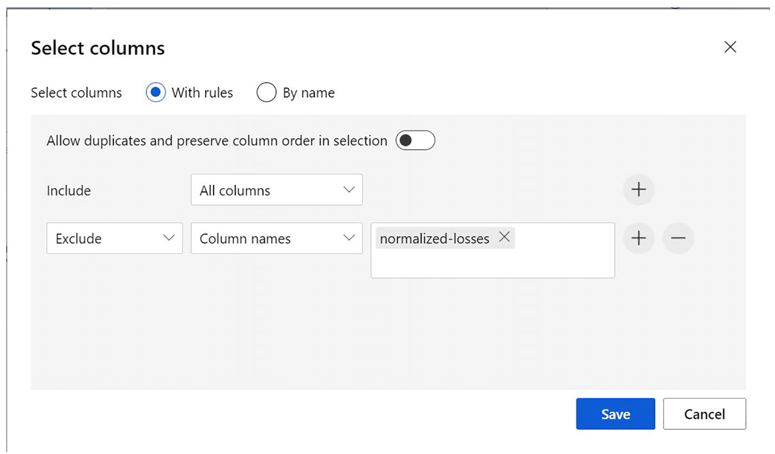
Figure 3-19Final column selection on the dataset

